
 ByteLabb Membership
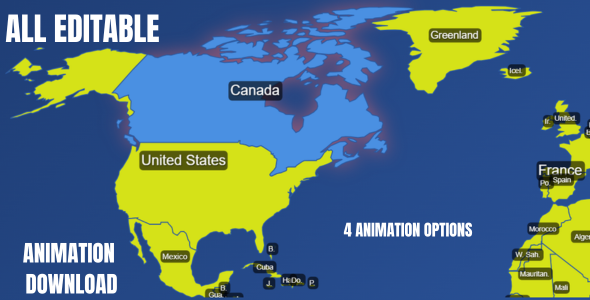
GlobeMotion Pro – Interactive World Map Editor
$18.00
Real World Interactive Map – Complete Documentation
Project Overview
Complete Interactive Mapping Solution – A feature-rich web application for global mapping experiences
Modern Technology Stack – Built with D3.js, Tailwind CSS, and vanilla JavaScript
User-Friendly Design – Combines technical excellence with easy-to-use interface
Multi-Purpose Application – Suitable for education, business, research, and personal use
Key Features
Core Mapping Features
Interactive world map with multiple projection systems
Advanced zoom, pan, and navigation controls
Real-time coordinate tracking and display
Dynamic country labeling and major city markers
Multiple map projections including Natural Earth, Mercator, and Globe View
Complete color scheme customization for countries and borders
Customization OptionsAdjustable border widths and styling options
Custom pin management system with coordinate tracking
Flexible animation settings and durations
Responsive design that works on all devices
8 international languages: English, Urdu, Arabic, Spanish, French, German, Chinese, Hindi
Multi-Language SupportEasy language switching with real-time interface updates
Comprehensive country name translations
Simple process to add new languages
✈️ Advanced Animations
Airplane flight animations between selected countries
Multiple animation types: wave, pulse, rotate, and zoom effects
Adjustable animation speeds and durations
Smooth flight paths with realistic airplane movement
Screen recording capabilities for map sessions
Recording & ExportExport options: GIF, MP4 video, and PNG images
Customizable recording quality and frame rates
Real-time recording with live preview
Technical Specifications
Technology Stack
Frontend Framework: HTML5 + JavaScript ES6+
Styling: Tailwind CSS (latest version)
Mapping Engine: D3.js v7.x
Data Format: TopoJSON v3.x
Icons: Custom SVG icons
Browser Compatibility
✅ Chrome 90+ (Full support)
✅ Firefox 88+ (Full support)
✅ Safari 14+ (Full support)
✅ Edge 90+ (Full support)
File Structure
text
project-root/
├── index.html # Main application file
├── styles.css # All CSS styles and animations
├── script.js # Core JavaScript functionality
└── README.md # Documentation file
Installation Guide
System Requirements
Web server (Apache, Nginx, or any static file server)
Modern web browser with JavaScript enabled
Minimum 2GB RAM recommended
Internet connection for CDN libraries
Quick Setup Steps
Download and extract the zip file to your webroot directory
Configure web server to serve files from same directory
Set up MIME types for .html, .css, and .js files
Enable gzip compression for better performance
Access application via http://your-domain.com/index.html
Server Configuration Examples
Apache Configuration (.htaccess):
Enable compression for HTML, CSS, and JavaScript files
Set expiration headers for better caching
Configure proper MIME types
Nginx Configuration:
Set up gzip compression for text files
Configure proper file serving
Set up location rules for single-page application
Customization Guide
Color Scheme Changes
Edit styles.css file to modify visual appearance
Change background gradients for different themes
Customize country fill colors and border styles
Adjust pin colors and marker appearances
Adding New Languages
Locate translations object in script.js file
Add new language block with all required translation keys
Include translations for all interface elements
Test language switching functionality
Map Projections Available
Natural Earth: Balanced global projection
Mercator: Traditional navigation map projection
Globe View: 3D spherical representation
Equirectangular: Simple cylindrical projection
Robinson: Compromise projection for world maps
Feature Configuration
Pin System Settings
Set maximum number of pins allowed (default: 50)
Customize pin appearance: colors, size, style
Configure pin storage and management
Set coordinate display formats
Animation Configuration
Adjust animation durations for different effects
Configure flight animation speeds
Set transition timings for smooth interactions
Customize easing functions for animations
Export Quality Settings
Adjust recording quality (0.1 to 1.0 scale)
Set frame rate for video exports
Configure image compression levels
Customize export file naming conventions
API Reference
Core Functions
initializeMap(): Sets up map with default settings
selectCountry(): Handles country selection logic
addPin(): Creates pins at specified coordinates
startRecording(): Initiates screen recording sessions
Event System
Country selection events with data payload
Pin addition and removal events
Recording start, progress, and completion events
Animation start and end events
Troubleshooting Guide
Common Issues & Solutions
Map Not Loading:
Check internet connection for CDN dependencies
Verify firewall settings aren’t blocking resources
Ensure all files are properly served from server
Slow Performance:
Reduce animation quality settings
Enable hardware acceleration in browser
Limit number of displayed city markers
Simplify GeoJSON data for better performance
Recording Failures:
Ensure browser allows screen recording permissions
Check available disk space for recording storage
Verify browser compatibility with MediaRecorder API
Language Issues:
Confirm all translation keys are properly defined
Check language code formatting
Verify translation object structure
Performance Optimization
Implement data simplification for large datasets
Use memory management for cached data
Limit simultaneous animations
Optimize image and asset loading
Credit Attribution
Third-Party Libraries
D3.js v7.x: Data visualization and mapping (BSD-3-Clause License)
TopoJSON v3.x: Geographic data processing (BSD-3-Clause License)
Tailwind CSS: Utility-first CSS framework (MIT License)
Data Sources
Country boundaries from Natural Earth Data
City information from curated public datasets
Projection algorithms from D3.js geographic library
Development Credits
Interactive Map Framework: Custom implementation
UI/Design System: Tailwind CSS with custom components
Animation Engine: Custom JavaScript implementation
Multi-language Support: Comprehensive translation system
Support & Maintenance
Version History
v1.0 (Current): Initial release with core functionality
v1.1 (Planned): Additional projections and export formats
v1.2 (Planned): Mobile app integration and enhanced features
Getting Help
First, check this complete documentation
Verify your browser compatibility
Test with default settings to isolate issues
Contact support with detailed error information
Update Instructions
Always backup your customizations first
Replace core files (index.html, styles.css, script.js)
Test all functionality thoroughly
Update documentation references as needed
License Information
Usage Rights
✅ Personal and commercial use allowed
✅ Modification and customization permitted
✅ Redistribution in compiled projects allowed
❌ Reselling of source code prohibited
❌ Claiming original authorship prohibited
Attribution Requirements
Please include this credit in your project documentation:
text
Interactive Map Component
Powered by Real World Interactive Map
Includes D3.js and TopoJSON libraries
Conclusion
The Real World Interactive Map provides a comprehensive mapping solution that combines powerful features with user-friendly design. Its flexible architecture allows for extensive customization while maintaining excellent performance across different use cases. Whether for educational purposes, business applications, or personal projects, this application offers a robust foundation for all your geographic visualization needs.
Happy Mapping! ✨
Documentation Version: 1.0 | Last Updated: October 2025 | Compatible with Map Version: 1.0
| Compatible Browsers | IE6, IE7, IE8, IE9, IE10, IE11, Firefox, Safari, Opera, Chrome, Edge |
|---|---|
| Compatible Software | HTML5 |
| Demo Url | https://awais Abid284.github.io/World Map |
| High Resolution | Yes |
| Source Files Included | JavaScript JS, HTML, CSS |
| Video Preview Resolution | 640×360 |
Only logged in customers who have purchased this product may leave a review.
Related products


Reviews
There are no reviews yet.